Power BI
Overview
The Fusion Signage Power BI integration allows you to seamlessly display Power BI reports on your digital signage screens. This enables businesses to share real-time data, dashboards, and insights with employees, customers, or stakeholders directly through their digital displays.
With this integration, you can:
✅ Showcase live Power BI reports on your screens
✅ Showcase real-time data for up-to-date insights
✅ Schedule and tag reports for targeted display times
✅ Easily manage your reports within Fusion Signage like any other media item - simply add them to playlists and send them to your screens seamlessly
Watch our Demo
Pre-requisites
- Fusion Signage PRO Licence
- Application Version Minimums
- Android 2.6.2
- Tizen 2.4.1
- WebOS 2.3.5
- Brightsign 2.4.0
- Windows 2.4.0
If you need help updating your devices to a newer app version, please contact support@fusionsignage.com.au
Publishing a Power BI report to an app version below this will result in the file being ignored as it cannot render the file.
Important to Note
In order to set-up the link between your Fusion Signage account, and your Power BI account, the user to establish the connection needs to have an appropriate level of permission to allow access to the Office 365 account.
Only one connection can be made between Fusion Signage and Office 365. Therefore, only the reports that the user who established the connection can access will be available within Fusion Signage.
Once the connection is made, all users within the Fusion Signage account will then have access to the reports of the user that made the connection.
You can consider creating a dedicated user (e.g. signage-reports@yourcompany.example.com) in your Microsoft account which has access to the specific reports you require within your Fusion Signage account, in order to better manage the data shared across.
Getting Set-Up
Step 1: Connect Fusion Signage to Power BI
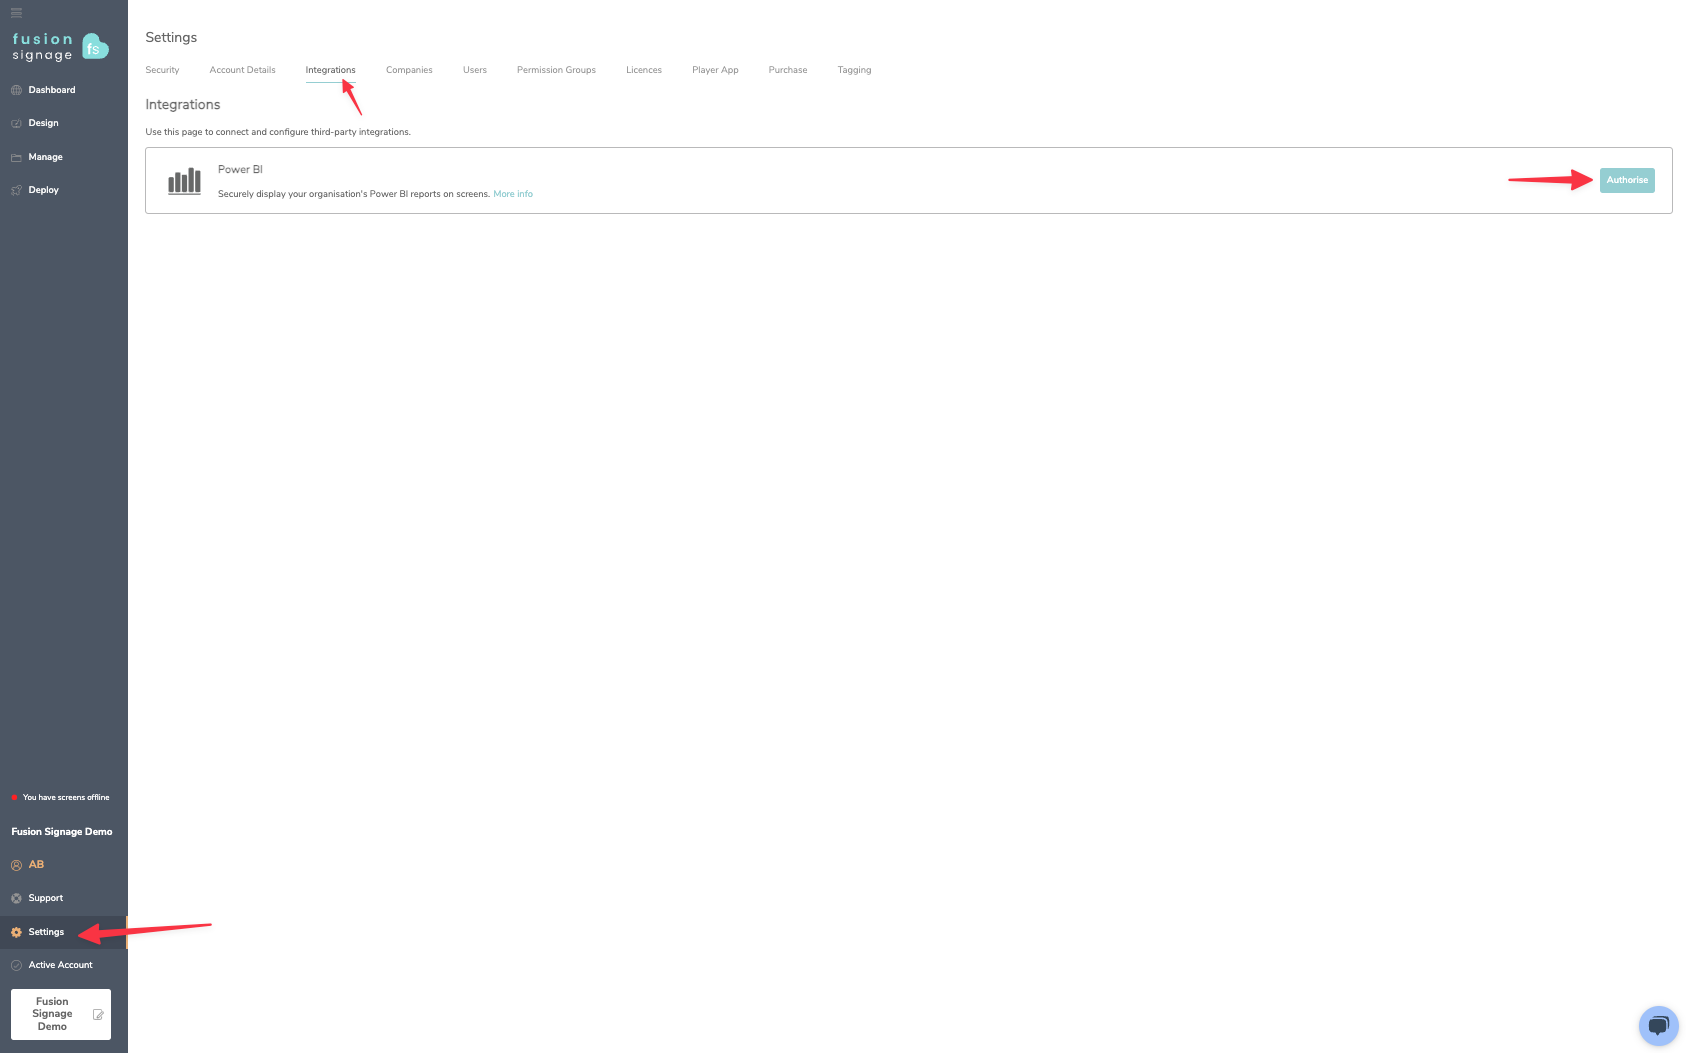
Log in to your Fusion Signage account
Navigate to Settings in the main menu
Click on the Integrations tab and select Power BI
Click Authorise and follow the steps to connect your Power BI account
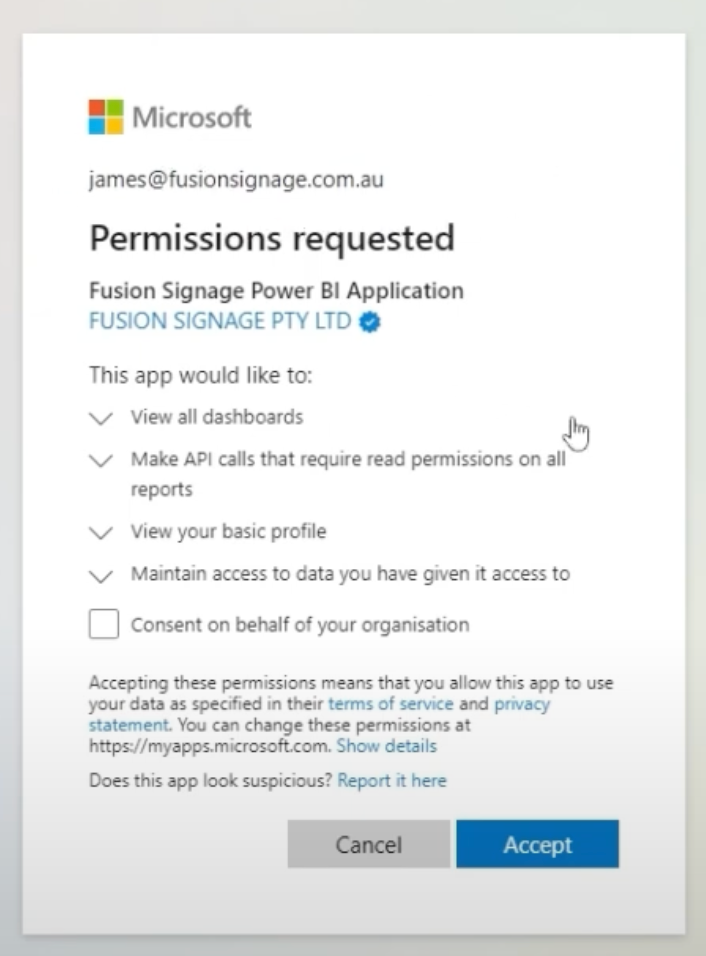
You will be required to log into your Microsoft account, so ensure it is the account that has the appropriate access to the reports you wish to share. Ticking Consent on behalf of your organisation grants Fusion Signage access to all reports in your company’s account. Only select this if you want all reports to be accessible; otherwise, access is limited to the reports available to the user authorising the integration.
Step 2: Add your Power BI report into your Fusion Signage account
- Navigate back to the Manage page in Fusion Signage
- Click into the folder where you want to add your reports. You can create a separate folder for these reports if you would like, but this is purely for organisational purposes
- Click Add, then select Power BI
- Choose the Power BI report you want to display from the dropdown
- Select the specific page from the report that you want to show
- Note - you will need to add a new page for each different page you would like to display.
- The report will now appear in your folder
Step 3: Display your report on a screen
- Create a new playlist or edit an existing one
- Click Add, then select Media and find your previously added Power BI report/s
- Apply any tagging or scheduling rules as needed
- Click Save & Publish to send the report to your screen
Filtering your Reports
You are able to filter your reports to only show relevant information to each specific screen. To do this;
- Navigate to the Deploy page
- Select the Screen Name from the list of devices
- Click Configure Screen
- Click Add under the Power BI Filters section and select the data required for that screen
- You can add as many filters as necessary to ensure only data relevant to that screen or region is showing
- Click Save to apply the filters to the screen
Removing the Integration
- Navigate to Deploy → Integrations
- Click Delete next to the Power BI Integration
- You can also remove the application from your Azure Active Directory but you may need your IT team to assist with that
- Log into https://portal.azure.com as a user with appropriate permissions
- Navigate to Microsoft Entra ID
- On the left under Manage, click on Enterprise Applications
- Search for Fusion Signage Power BI Application
- On the left under Manage, click on Properties
- Click Delete at the top
Best Practices
- Keep reports lightweight for better performance
- Use a dedicated Power BI workspace for signage reports
- Design your reports for readability
- Use consistent font sizes, colours and layouts
- Keep charts and visuals simple to avoid clutter
Potential Errors and their meanings
no-cache
- This is likely the first time the report has attempted to render and we are still in the process of taking a screenshot of the report - We’re still syncing your data. Please check back later.
no-internet-no-cache
- The screen is offline so can’t render the Live report, and has no backup screenshot to play instead. You will need to bring your screen back online to view your report.
unsupported-no-cache
- Previews of the Power BI reports are not available within the Fusion Signage portal. The report should be displaying fine on the screen itself, we are just not able to provide a screenshot in the preview window of the portal.
fatal-error-no-cache
- Please contact us at support@fusionsignage.com.au. There is likely something wrong with your device and the authentication on the device is being rejected. We will likely need to help you reinstall the application on your device.
FAQs
What happens if my screen goes offline?
- When a report is deployed to the screen, a screenshot version of the report is cached to the device. This screenshot is updated each time the report refreshes with new data. In the event that your screen loses connectivity, the screen will continue to display the most recently cached screenshot. The screen will not receive any updated data until it is brought back online.
My reports load slow, or part of it fails to load.
- If your data is slow to render, or part of the report fails to render you may need to look at upgrading your Capacity within Microsoft. Read more about Capacity here - https://learn.microsoft.com/en-us/power-bi/developer/embedded/embedded-capacity